Key Facts About Fueling
Information about gasoline and oil demand, fuel supply, refining, distribution and retail operations.
Jun 29, 2026 | 1 min read
Crude Oil and Liquid Fuels
Worldwide crude oil and liquid fuels demand (which includes natural gas plant liquids, biofuels and other liquids) in 2026 is expected to average 104.8 million barrels per day, up from the 103.7 million barrels per day demand in 2025. (Source: U.S. Energy Information Administration, Short-Term Energy Outlook, January 2026)
U.S. crude oil and liquid fuels consumption in 2026 is expected to average 20.6 million barrels per day, the same as in 2025. U.S. demand is 19.7% of total world total, the most demand of any country. China has the second-highest expected demand for 2026 at 16.8 million barrels per day in 2026. (Source: U.S. Energy Information Administration, Short-Term Energy Outlook, January 2026)
Gasoline Demand
U.S. gasoline demand in 2026 is expected to be 8.9 million barrels per day, approximately 370 million gallons per day, or about 37 million fill-ups per day (based on a 10-gallon fill-up). Demand peaked at a record 9.3 million barrels per day in 2018. (Source: U.S. Energy Information Administration, Short-Term Energy Outlook, January 2026)
Consumption of ethanol-blended into gasoline is expected to average 1.07 million barrels per day in 2026; the ethanol share in gasoline is expected to average 12.1%. (Source: U.S. Energy Information Administration, Short-Term Energy Outlook, January 2026)
Typically, U.S. gasoline demand increases during the first half of the year (beginning in February) and peaks in the warmer months. In 2025, that gasoline pattern largely held, with demand peaking in July and August, during peak vacation travel season. Demand in August 2025 was 743 thousand barrels/day more (8.8%) than in January 2025.
| Month in 2025 | Gasoline demand (million barrels/day) |
| January | 8.483 |
| February | 8.681 |
| March | 8.765 |
| April | 8.910 |
| May | 9.057 |
| June | 9.262 |
| July | 9.150 |
| August | 9.226 |
| September | 8.974 |
| October | 8.888 |
| November | 8.680 |
| December | 8.759 |
(Source: U.S. Energy Information Administration, U.S. Product Supplied of Finished Motor Gasoline and Weekly U.S. Product Supplied of Finished Motor Gasoline for December)
Gasoline demand is expected to be 43% of total U.S. petroleum demand in 2026. (Source: U.S. Energy Information Administration, Short-Term Energy Outlook, January 2026)
U.S. Vehicles
There were 298.7 million registered vehicles in the United States in 2025. (Source: Hedges & Company )
Americans travelled 9.065 trillion miles per day in 2025. EIA predicts that travel will increase to 9.101 trillion miles per day in 2026. With 298.7 million registered vehicles in the United States, the average vehicle will travel approximately 30 miles per day, which slightly less than the 33 miles/day average before the pandemic. This equates to 11,100 miles per vehicle for the year. (Source: U.S. Energy Information Administration, Short-Term Energy Outlook, February 2025)
The average age of vehicles on U.S. roads has steadily increased. In 2000, the average age of light-duty vehicles was 8.9 years; in 2025 the average reached a record 12.8 years. (Source: Bureau of Transportation Statistics )
91.6% of American households have access to at least one vehicle. New York has the highest percentage of residents without access to a car (29%), followed by Massachusetts (12%). (Source: ValuePenguin , citing U.S. Census data)
Transportation-related costs were 17% of all household spending in 2024; of that, $2,411 was for gasoline. (Source: U.S. Bureau of Labor Statistics )
New vehicle sales increased 1.9% to 16.3 million units in 2025, the highest since new car sales were around 17 million before the pandemic. (Source: MarkLines )
New vehicle sales are expected to decline 2.4% to 15.8 million in 2026. U.S. used-vehicle sales are expected to be 38.3 million units in 2026, down 0.9% over 2025, including 20.3 million sold at retail. The rest of used-vehicle sales are “private party”—neighbor to neighbor deals. (Source: 2026 Cox Automotive Forecasts)
The Ford F-Series remained the top-selling new vehicle in the United States for the 44th consecutive year. The top four best-selling passenger vehicles in 2025 were trucks:
- Ford F-Series (801,525 sold)
- Chevrolet Silverado (577,434 sold)
- Toyota RAV4 (479,288 sold)
- Honda CR-V (403,768 sold)
- Ram Pickup (374,059 sold)
(Source: Car and Driver)
The fuel economy for model year 2024 passenger vehicles increased 0.9 mpg to a record 28 miles per gallon. (Source: U.S. Department of Energy)
U.S. EV sales were 1.28 million in 2025, a 2% decline from the record 1.30 million EVs sold in 2024. EVs were 7.8% of all new vehicle sales in 2025. (Source: Cox Automotive )
U.S. Drivers
There were 242.3 million licensed drivers in 2025; 91% of American adults age 18 or older have a driver’s license. (Source: Hedges & Company )
The average American commute by car was 26 minutes each way, but commute times vary greatly: 22% had commutes of 15 minutes or less while 3% had commutes of 120 minutes or longer. Three in four commuters (77%) drive to work. (Source: Auto Insurance )
Convenience stores have the most transactions on Fridays (17% of total transactions) followed by Thursdays and Wednesdays (15% each). Sundays are the slowest day of the week (12%). (Source: SwiftIQ, now PDI)
There are 4.16 million miles of road in the United States, of which 2.84 million miles are paved. (Source: U.S. Bureau of Transportation Statistics, Public Road and Street Mileage in the United States by Type of Surface)
World crude oil and liquid fuels supply in 2026 is expected to be 107.7 million barrels per day, up from 106.3 million barrels per day in 2025. World production is expected to surpass consumption by 2.83 million barrels per day. (Source: U.S. Energy Information Administration, Short-Term Energy Outlook, January 2026)
OPEC countries are expected to supply 33.9 million barrels per day of total liquid fuels in 2026 (31.5% of total world supply). OPEC+ (the countries in OPEC and other oil-exporting countries, most notably Russia) are expected to supply 44.9 million barrels per day—41.2% of total world supply. (Source: U.S. Energy Information Administration, Short-Term Energy Outlook, January 2026)
U.S. production of petroleum and other liquids was 23.6 million barrels per day in 2025 and is expected to increase to 23.9 million barrels per day in 2026, 22.2% of the world’s total production. (Source: U.S. Energy Information Administration, Short-Term Energy Outlook, January 2026)
U.S. crude oil production was a record 13.6 million barrels per day in 2025 and is expected to remain at that level in 2026. (Source: U.S. Energy Information Administration, Short-Term Energy Outlook, January 2026)
The top five producers of petroleum and other liquids in 2025:
- United States: 23.6 million barrels per day (13.6 million barrels per day of crude oil)
- Saudi Arabia: 11.2 million barrels per day (crude oil only)
- Russia: 10.5 million barrels per day
- Canada: 6.3 million barrels per day
- China: 5.5 million barrels per day
(Source: U.S. Energy Information Administration, Short-Term Energy Outlook, January 2026)
U.S. Oil Imports and Exports
The U.S. imports more petroleum products from Canada than any other country, an estimated 60-68%.
(Source: U.S. Energy Information Administration)
Crude oil imports have been relatively low the last few years. In 2025, monthly imports of crude oil and petroleum products ranged from 2.0 to 3.9 million barrels per day. From 1994 to 2018, imports of crude oil and petroleum products were at least 7 million barrels per day and topped 10 million barrels per day several times. The United States first tracked oil imports in 1902, when it imported 2,000 barrels per day. (Source: U.S. Energy Information Administration, U.S. Imports by Country of Origin)
Strategic Petroleum Reserve
With a capacity of 714 million barrels, the U.S. Strategic Petroleum Reserve (SPR) is the largest stockpile of government-owned emergency crude oil in the world. As of January 9, 2025, the SPR had 413.7 million barrels of inventory. The SPR was established in 1975 in the aftermath of the 1973-1974 oil embargo to provide emergency crude oil supplies for the United States. The oil is stored at four sites with deep underground (Source: U.S. Department of Energy, SPR Quick Facts and FAQs)
It takes about 13 days from the time a presidential decision is made to tap the SPR for oil to enter the U.S. market. (Source: U.S. Department of Energy, SPR Quick Facts and FAQs)
Refining
Nearly 60% of U.S. refineries have closed over the past 40 years. In 1982, the earliest data provided, there were 301 operational refineries. There were 131 operating refineries in 2025. The last major refinery built in the United States was completed in 1976. (Source: U.S. Energy Information Administration, Number and Capacity of Petroleum Refineries )
Despite the precipitous drop in the number of refineries operating in the United States, domestic refining capacity has only slightly declined. Increases in facility size and improvements in efficiencies have offset much of the lost physical capacity of the industry. The operating capacity of U.S. refineries was a record 18.98 million barrels of crude oil per day in 2020 but has dropped to 18.42 million barrels per day in 2025. (Source: U.S. Energy Information Administration, U.S. Refinery Operable Atmospheric Crude Oil Distillation Capacity)
On average, a 42-gallon barrel of oil produces 19 to 20 gallons of gasoline, 11 to 13 gallons of distillate fuel (largely diesel), 3 to 4 gallons of jet fuel and 6 gallons of other refined product as part of the refining process in U.S. refineries. The total of refined product is more than the input because of refinery processing gain. (Source: U.S. Energy Information Administration, Refining Crude Oil)
The Marathon Petroleum refinery in Galveston Bay, Texas, has a capacity of 631,000 barrels of crude oil per day, making it the largest refinery in the United States and one of the 10 largest in the world. Six U.S. refineries have operable capacities of at least 500,000 barrels per day. (Source: U.S. Energy Information Administration)
Planned periodic shutdowns of refineries, called turnarounds, allow for the regular maintenance, overhaul, repair, inspection and testing of plants and their process materials and equipment. They are scheduled up to 10 years in advance and usually when demand for refined product is at its lowest level, typically early in the year. The industry average is about four years between turnarounds. During this time, refineries also may optimize their operations so that they can refine summer-blend fuel. (Source: U.S. Energy Information Administration (PDF))
Refined Product Tankers
General purpose tankers are often used to transport refined product on shorter trips, such as between North America and Europe. They can transport 70,000 to 190,000 barrels per tanker. Crude oil from the Middle East is moved mainly by Very Large Crude Carriers capable of delivering 2 million barrels per trip. A small number of Ultra-Large Crude Carriers can deliver as much as 3.7 million barrels of crude oil. By comparison, a train of 100 cars can transport 3 million gallons, and a truck typically holds 9,000 gallons. (Source: U.S. Energy Information Administration)
More than 20% of all oil is transported through the Strait of Hormuz, which links Middle East crude producers to markets in Asia Pacific, Europe and North America. (Source: U.S. Energy Information Administration, The Strait of Hormuz is the World’s Most Important Chokepoint)
Fuel Pipelines
Overall, 83% of crude oil and refined products are transported by pipeline, with 9% transported by rail and 8% transported by water carrier; 92% of crude oil is transported by pipeline. (Source: Bureau of Transportation Statistics )
The first oil pipeline in the United States was built in 1865, following the 1859 discovery of oil in Pennsylvania. Today, pipelines are the most important petroleum supply line in the U.S. for transporting crude oil, refined fuel and raw materials. Pipeline transport crude oil and more than 50 refined petroleum products, including various grades of gasoline, home heating oil, diesel fuel, jet fuel and kerosene. (Source: Pipeline 101, The History of Pipelines)
The diameter of pipelines varies greatly. For cross-country crude oil transport, diameters are typically 8 to 24 inches but are as large as 48 inches for the Trans-Alaska Pipeline System. Pipelines for refined products range in size from 8 to 42 inches. (Source: Pipeline 101, How Do Pipelines Work?)
There are 229,888 miles of U.S. oil, refined products and natural gas liquids pipeline. This includes over 80,000 miles of crude oil pipelines, 70,000 natural gas liquids pipeline miles and 62,000 miles of petroleum products pipeline. (Source: Pipeline 101: Where Are Pipelines Located? )
The Colonial Pipeline is the country’s largest pipeline system, spanning 5,500 miles from Houston, Texas, to New York Harbor (Linden, New Jersey) and transporting more than 100 million gallons of fuel daily. (Source: Colonial Pipeline Company)
Crude oil moves through pipelines at about 3 to 8 miles per hour (about a walking pace), but other products can move through faster depending upon line size, pressure and other factors such as the density and viscosity of the liquid being transported. For example, natural gas can travel as fast as 25 miles per hour. On average, it takes from 14 to 22 days to move liquids from Houston to New York City. (Source: How Pipelines Make the Oil Market Work — Their Networks, Operation and Regulation)
Ethanol transportation by pipeline is not widespread; it is generally blended at the local wholesale terminal for use as E10 or E85. Because ethanol has an affinity for water and is a better solvent than gasoline, it is more likely to bind to any water in pipelines or pick up impurities. In addition, gasoline pipelines generally start in the South, near petroleum refineries. Because most ethanol is produced in the Midwest, the current pipeline system is not conducive to transporting the alternative fuel. (Source: U.S. Department of Transportation)
Rail Transport
The freight rail network is nearly 140,000 miles. The amount of crude oil transported by rail carload varies by the source of the oil, the type of tank car used and the season of the year. In 2023, the average carload of crude oil originated in the United States carried 650 barrels of oil. The 97,000 carloads of crude oil originated by U.S. Class I railroads in 2023 was equivalent to around 173,000 barrels per day, or approximately 1.3% of total U.S. production. (Source: Association of American Railroads)
As much as 70% of ethanol product in the United States moves throughout the country by rail. Most ethanol carried by railroads moves in 30,000-gallon tank cars. (Source: Association of American Railroads, Freight Rail and Energy)
Brent crude oil spot prices averaged $69.04 per barrel in 2025. West Texas Intermediate (WTI) crude oil spot prices averaged $65.40 per barrel in 2025. (Source: U.S. Energy Information Administration, Short-Term Energy Outlook, January 2026)
With 42 gallons in each barrel of oil, a $1 change in the price of a barrel of oil roughly translates to a 2.4-cent change per gallon at the pump.
U.S. retail (regular) gasoline prices averaged $3.10 per gallon in 2025. (Source: U.S. Energy Information Administration, Short-Term Energy Outlook, January 2026)
On-road diesel fuel averaged $3.61 per gallon in 2025. (Source: U.S. Energy Information Administration, Short-Term Energy Outlook, January 2026)
The year 2026 began with gas prices under $3 per gallon for the first time since 2021:
2026: $2.80 per gallon
2025: $3.05
2024: $3.09
2023: $3.22
2022: $3.28
2021: $2.25
2020: $2.58
2019: $2.24
2018: $2.52
2017: $2.38
(Source: U.S. Energy Information Administration, Gasoline and Diesel Fuel Update)
The biggest factor in the cost of a gallon of gas in 2025 was the cost of crude oil (51.4%). Other contributing costs were refining (14.3%), taxes (16.6%) and distribution and marketing (17.8%). This last category includes all post-refinery expenses and retailer profit. (Source: U.S. Energy Information Administration, Gasoline Pump Components History, Jan.-Dec. 2025)
Price volatility has been extreme over the past two decades. Daily crude oil prices fluctuated between a low of $18.28 in November 2001 to a high of $147.27 per barrel in July 2008. (WTI oil futures briefly dipped to -$37 per barrel in April 2020.) Daily national average gasoline prices fluctuated between a low of $1.06 in December 2001 to a high of $5.02 in June 2022. The highest diesel fuel price recorded was $5.82, also in June 2022. The highest average price in a state is $6.44 for gasoline and $7.01 for diesel fuel, both in California in June 2022. (Source: AAA, U.S. Energy Information Administration data)
Weekly gas prices hit a record $5.01 per gallon on June 13, 2022. The last time before 2022 that gas prices on a national level averaged more than $4 per gallon was July 21, 2008 ($4.06). (Source: U.S. Energy Information Administration, Gasoline and Diesel Fuel Update, weekly U.S. regular, all formulations)
| Year | Date | Price | Peak Date | Price | Increase | % increase |
| 2026 | Feb. 2 | $2.867 | TDB | TDB | ||
| 2025 | Feb. 3 | $3.082 | April 7 | $3.243 | 16.1¢ | 5.2% |
| 2024 | Feb. 5 | $3.136 | April 22 | $3.668 | 53.2¢ | 14.5 |
| 2023 | Feb. 6 | $3.444 | April 24 | $3.656 | 21.2¢ | 6.2 |
| 2022 | Feb. 7 | $3.444 | June 13 | $5.006 | $1.56 | 45.4 |
| 2021 | Feb. 1 | $2.409 | March 22 | $2.865 | 45.6¢ | 18.9 |
| 2020 | Feb. 3 | $2.455 | Feb. 24* | $2.466 | 1.1¢ | 0.4 |
| 2019 | Feb. 4 | $2.254 | May 6 | $2.897 | 64.3¢ | 28.5 |
| 2018 | Feb. 5 | $2.637 | May 28 | $2.962 | 32.5¢ | 12.3 |
| Feb. 6 | $2.293 | April 24 | $2.449 | 15.6¢ | 6.8 | |
| 2016 | Feb. 1 | $1.822 | June 13 | $2.399 | 57.7¢ | 31.7 |
| 2015 | Feb. 2 | $2.068 | June 15 | $2.835 | 76.7¢ | 37.1 |
| 2014 | Feb. 3 | $3.293 | April 28 | $3.713 | 42.0¢ | 12.8 |
| 2013 | Feb. 4 | $3.538 | Feb. 25 | $3.784 | 24.6¢ | 7.0 |
| 2012 | Feb. 6 | $3.482 | April 2 | $3.941 | 45.9¢ | 13.2 |
| 2011 | Feb. 7 | $3.132 | May 9 | $3.965 | 83.3¢ | 26.6 |
| 2010 | Feb. 1 | $2.661 | May 10 | $2.905 | 24.4¢ | 9.2 |
| 2009 | Feb. 2 | $1.892 | June 22 | $2.691 | 79.9¢ | 42.2 |
| 2008 | Feb. 4 | $2.978 | July 21 | $4.104 | $1.126 | 37.8 |
| 2007 | Feb. 5 | $2.191 | May 21 | $3.218 | $1.027 | 46.9 |
| 2006 | Feb. 6 | $2.342 | May 15 | $2.947 | 60.5¢ | 25.8 |
| 2005 | Feb. 7 | $1.909 | April 11 | $2.280 | 37.1¢ | 19.4 |
| 2004 | Feb. 2 | $1.616 | May 24 | $2.064 | 44.8¢ | 27.7 |
| 2003 | Feb. 3 | $1.527 | March 17 | $1.728 | 20.1¢ | 13.2 |
| 2002 | Feb. 4 | $1.116 | April 8 | $1.413 | 29.7¢ | 26.6 |
| 2001 | Feb. 5 | $1.443 | May 14 | $1.713 | 27.0¢ | 18.7 |
| 2000 | Feb. 7 | $1.325 | June 19 | $1.681 | 35.6¢ | 26.9 |
*Demand was significantly reduced by the rapidly spreading COVID-19 pandemic beginning in late February 2020.
(Source: U.S. Energy Information Administration, Gasoline and Diesel Fuel Update, weekly U.S. regular, all formulations)
Gasoline Taxes
Taxes and fees averaged 48.7 cents per gallon in July 2025. This total includes 18.4 cents per gallon in federal taxes, plus state and local taxes. (Source: U.S. Energy Information Administration, Federal and state motor fuel taxes)
The states with the highest state gasoline taxes in 2026 (including the 18.4 cent-per-gallon federal tax) are:
- California (89.3 cents per gallon)
- Illinois (84.8 cents)
- Washington (77.4 cents)
(Source: World Population Review)
The states with the lowest state gasoline taxes in 2026 (including the 18.4 cent-per-gallon federal tax) are:
- Alaska (27.4 cents per gallon)
- Hawaii (36.9 cents)
- New Mexico (37.3 cents)
(Source: World Population Review)
Diesel fuel taxes and fees averaged 59.7 cents per gallon in July 2025, which includes 24.4 cents per gallon in federal taxes. The state with the highest total diesel fuel taxes is California at $1.117 per gallon and the state with the lowest diesel fuel tax is Alaska at 33.4 cents per gallon. (Source: U.S. Energy Information Administration, Federal and state motor fuel taxes)
Retail Fueling Sites
There are an estimated 150,000 fueling outlets in the country. In addition to 122,620 convenience stores selling fuel there are 12,659 fueling kiosk locations and 6,648 hypermart locations. The rest are traditional service stations without a small convenience offer and small-volume locations that include marinas. Sources: 2026 NACS/NIQ TDLinx Convenience Industry Store Count , EAI Inc.)
Convenience stores sell approximately 80% percent of the motor fuels purchased in the United States. (NACS State of the Industry data)
As of December 2025, there were 122,620 convenience stores selling motor fuels in the United States. This represents 80.7% of the 151,975 convenience stores in the country. (Source: 2026 NACS/NIQ Convenience Industry Store Count )
With 9.8 fueling positions per c-store selling fueling, there are cumulatively more than 1.2 million fueling positions in the industry. (Source: NACS State of the Industry Report of 2024 Data)
Most convenience stores selling gasoline are one-store operations: 54.8% (67,252 stores) of the convenience stores that sell fuel are one-store operations. (Source: 2026 NACS/NIQ TDLinx Convenience Industry Store Count )
In addition to convenience stores and fuel focused retail sites, there are 6,945 big-box (also known as “hypermart”) retail sites selling fuel, including grocery club and warehouse stores. These typically have sales volumes that are approximately twice the amount sold by traditional retailers (average fuel sales per store basis). (Source: EAI, Inc. [Energy Analysts International], U.S. Retail Fuel Market Insights and Outlook 2026)
The top five account for 68% of total hypermart sites:
- Kroger (1,695 sites)
- Walmart (1,563)
- Costco (574)
- Sam’s Club (531)
- Albertson’s / Safeway + Legacy Banners / United of Texas (377)
(Source: EAI, Inc. [Energy Analysts International], U.S. Retail Fuel Market Insights and Outlook 2026)
There are 246,326 public alternative fueling options in the United States as of January 2026: Electricity (76,725 stations/235,077 charging outlets, of which 67,550 are DC fast charge), E85 (4,844 sites), propane (2,617 sites), compressed natural gas (718 sites), renewable diesel (1,481 sites), liquefied natural gas (25 sites) and hydrogen (52 sites, all but two in California). Because some stations have multiple fueling options, the actual station count is lower. (Source: U.S. Department of Energy , Alternative Fueling Station Counts by State)
The growth of EV sales will be dependent upon the ability to charge at home. Slightly more than half of all drivers (53%) say that they have a garage, driveway, parking spot or other suitable location to charge an EV. (Source: NACS May 2025 Consumer Fuels Survey)
Gasoline Customers
More than half of all gas customers (62%) go inside the store, whether to buy an item, pay for their gas at the register or use the bathroom or ATM. (Source: NACS February 2026 Consumer Fuels Survey )
Americans buy gas most often during the mid-day period. The morning daypart recovered to pre-pandemic levels after tapering off with more people working from home in 2020 and 2021:
- 25% buy gas at 6:00-10:00 am
- 33% buy gas at 10:00-3:00 pm
- 32% buy gas at 3:00-7:00 pm
- 9% buy gas at all other times
(Source: NACS May 2025 Consumer Fuels Survey)
Sales of premium and mid-grade have declined over the past few decades because consumers traded down octane levels when prices increased, bottoming out at approximately 8% of all gas sales before rebounding as more new cars with high-efficiency engines require it. Regular grade gasoline accounted for 85.8% of all gasoline gallons sold in 2021. (87.9% of all gas sold in March 2022, the most current month with data.) Premium accounted for 13.0%, up from 11.5% in 2019, and mid-grade continues to decline in popularity, accounting for only 1.2% of gasoline volume. In 1997, regular accounted for 71.6% of sales, mid-grade was 11.8% and premium was 16.6% (Source: U.S. Energy Information Administration, Prime Supplier Sales Volumes)
Overall, 57% of drivers say they typically fill up their tanks when they purchase fuel. This is down sharply from the 73% of drivers who filled up in 2020 during the peak of Covid-19. (Source: NACS March 2024 Consumer Fuels Survey)
Gasoline theft, also called drive-offs, is a problem at stores that don’t require prepay. The average loss per store in 2016 was $888 per store reporting theft. It is difficult to obtain an industrywide number because only a small percentage of stores today allow customers to pump their fuel before paying. Gasoline theft peaked in 2005 when it cost the industry an estimated $300 million. It had declined considerably since September 2005 (post-Hurricane Katrina when gasoline rapidly increased and topped $3 per gallon) as more stations began mandating prepay. However, new forms of theft involving high-tech fuel dispenser manipulation have emerged over the past few years. (Source: NACS State of the Industry data)
Convenience Store Expenses
More than four in five (81%) of all transactions at the pump are by card, whether debit (52%) or credit (29%). A decade ago, 64% of fuel customers paid with plastic. The percentage of customers paying for gas by cash dropped to as low as 14% in May 2020, when consumers shied away from handling cash and seeking options that minimize contact. (Source: NACS May 2025 Consumer Fuels Survey)
The cost of credit card fees was 8.4 cents per gallon in 2024. (Source: NACS State of the Industry Report of 2024 Data)
Fuel Margins
2025: 39.7 cents (12.7% of the price of fuel)
2024: 39.7 cents (11.9%)
2023: 39.4 cents (11.2%)
2022: 42.9 cents (10.8%)
2021: 29.9 cents (10.2%)
(Source: OPIS MarginPro)
Barrel: The unit of measure for petroleum products. A barrel holds 42 gallons and futures contracts are in 1,000-barrel lots. According to Daniel Yergin, the standard of a 42-gallon barrel dates to the year 1482, when King Edward issued a statute that 42 gallons was the standard for a barrel of herring.
Boutique Fuels: Unique gasoline blends required for a specific region or metropolitan area of the U.S. Prior to 1990, six types of gasoline were sold in the United States, and that grew to as many as 14 in the late 2010s. Today, there are 10 unique gasoline formulations, not including regular/mid-grade and premium octanes for each fuel, manufactured for and sold within specific markets throughout the country that are mandated by federal, state, and local governments. These fuels are not interchangeable with fuel blends sold in other areas of the country.
Branded Retail Outlet: A retailer that sells motor fuels with the brand name of a major oil company or refiner but is not necessarily owned (and is usually not owned) by that company. Branded retailers benefit from marketing and advertising support, consumer brand loyalty and priority access to gasoline supplies. Lately, a new benefit has emerged, with branded stations participating in loyalty programs with grocery chains. In return, the branded marketer pays a surcharge for the use of the brand and the benefits that come with it.
Contango: When crude oil market near-term prices are lower than longer-dated ones, such as in April and May 2020 when futures were negative. The opposite is “backward-dated”, which is when near-term prices are higher than longer-dated ones.
Ethanol-Blended Fuels (E10, E15, E85, etc.): E10 (90% gasoline and 10% ethanol) is approved for use in all new U.S. automobiles. Higher blends of ethanol (known as “flex fuels”) can be used in flex-fuel vehicles and under some other conditions. E15 is 85% gasoline and 15% ethanol and is approved by the U.S. Environmental Protection Agency for use only in vehicles manufactured in 2001 or later, but not in older vehicles, motorcycles, watercraft or small engines. E85 is not 85% ethanol; it is a mixture of gasoline with ethanol content between 51% to 83%.
Fuel Retailer: As of December 2025, 122,620 convenience stores sold gasoline and other fuels in the United States, representing 80.7% of country’s 151,975 convenience stores. These retailers are also referred to as “petroleum marketers.”
Fungible: Interchangeable. The U.S. gasoline system was designed to facilitate the efficient flow of gasoline to all regions of the nation, allowing the same gasoline formulation to be sold in all markets. The system is no longer fungible, with 10 unique gasoline formulations required in specific markets throughout the United States.
Futures: Crude oil futures have been traded on NYMEX since 1983 and are now the most heavily traded commodity. Futures trade in units of 1,000 U.S. barrels (42,000 gallons).
Trading terminates at the close of business on the third business day prior to the 25th calendar day of the month preceding the delivery month.
On-Demand Fueling (or Mobile Fueling): When fuel is delivered directly to fleets and individual consumers with pay-as-you-go, member- and subscription-based business models. The first wave of companies pioneering the concept in the 2010s largely replaced by new startups in the 2020s.
Organization of Petroleum Exporting Countries (OPEC): OPEC an international organization of 12 countries that are heavily reliant on oil revenues as their main source of income: Algeria, Congo, Equatorial Guinea, Gabon, Iran, Iraq, Kuwait, Libya, Nigeria, Saudi Arabia, United Arab Emirates and Venezuela. These countries collectively supply about 32% of the world’s crude oil and liquid fuels output and possess nearly 80% of the world’s total proven crude oil reserves. Twice a year, or more frequently if required, the oil and energy ministers of OPEC member countries meet to decide on its output level and consider whether any action to adjust output is necessary because of recent and anticipated oil market developments.
OPEC+: The 12 oil producing countries that are part of OPEC plus 11 other oil-producing countries—among them Russia, Kazakhstan and Mexico—that have also agreed to work together to regulate supply and help dictate oil prices. Collectively, they control approximately 41% of total supply and 90% of proven reserves.
Pass-Through: The time from which wholesale price changes fully reach consumers. Wholesale gasoline price increases—or decreases—paid by retailers are not immediately passed on to consumers but are spread over a period. A large portion of the price change is passed through immediately, with the rest spread over a period that could be eight weeks. Pass-throughs help minimize the price volatility of gasoline.
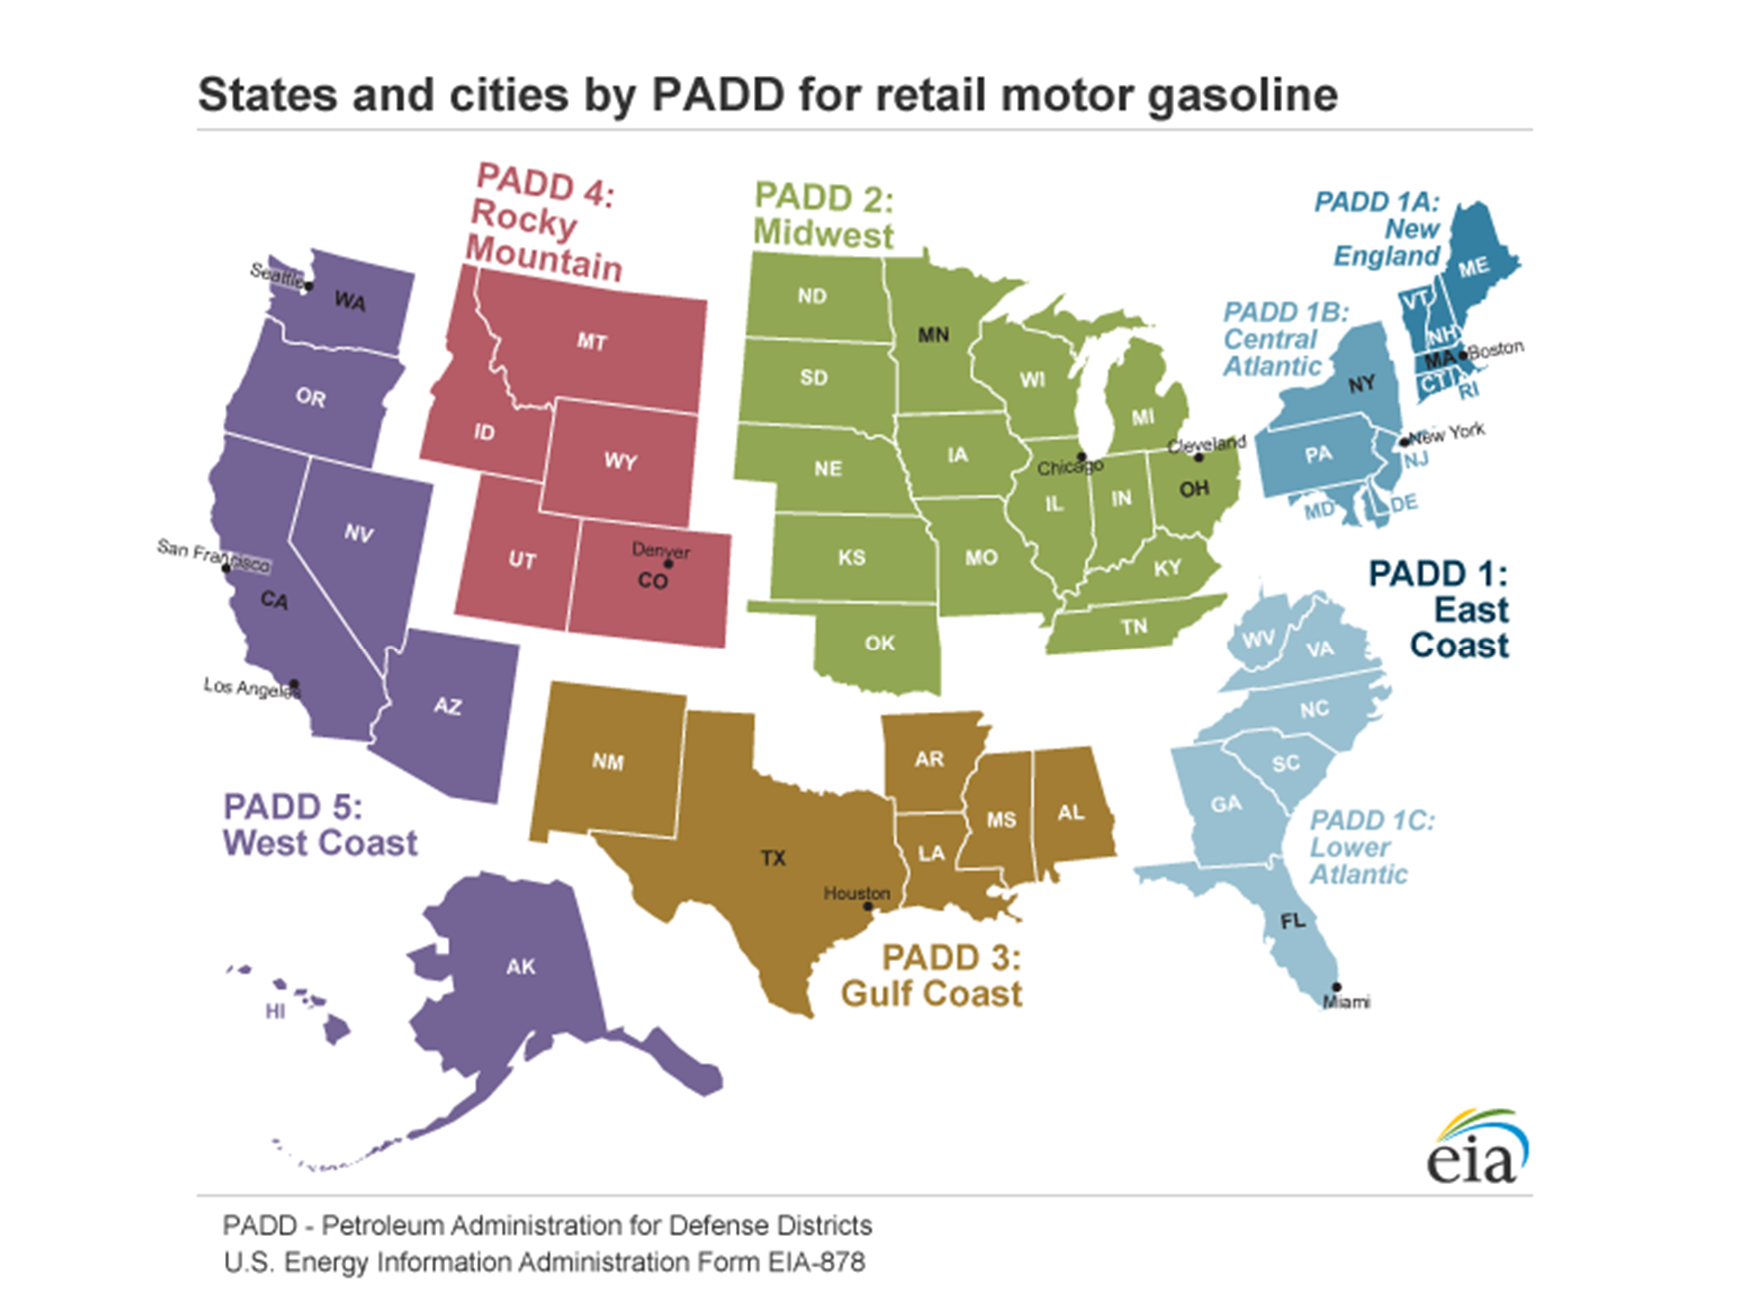
Petroleum Administration for Defense Districts (PADD): The U.S. Department of Energy divides the United States into five regions for planning purposes. The result is a geographic aggregation of the 50 states and the District of Columbia into five districts, each operating essentially as its own market. The five districts are: PADD I (East Coast), PADD II (Midwest), PADD III (Gulf Coast), PADD IV (Rocky Mountain) and PADD V (West Coast).
Refinery: Where crude oil is refined into a specific blend of gasoline or other fuels (such as diesel, kerosene, etc.) or for other oil-based applications. There are currently 131 operating refineries in the United States—less than half the number from 1981. No major new refinery has been built in the United States since 1976.
Reformulated Gasoline (RFG): The 1990 Clean Air Act Amendments required the most polluted metropolitan areas in the United States to sell a special blend of gasoline to reduce the emissions of ozone forming volatile organic compounds (VOCs) and toxic air pollutants. The first phase of the RFG program began in 1995, and the second (current) phase began in 2000. RFG is required in cities with high smog levels and is optional elsewhere. RFG is currently used in 17 states and the District of Columbia. Approximately 25% of gasoline sold in the U.S. is reformulated.
Replacement Costs: The cost to acquire the next shipment of fuel. This price is almost always different than the cost of the gas that retailers have in their tanks. Because of the enormous volume of fuel sold (an average store sells 3,00-4,000 gallons of gas a day), retailers must price their fuel based on their estimated cost of the next delivery. Even slight wholesale price variations can increase a retailer’s replacement cost by hundreds or even thousands of dollars. The importance of replacement costs is particularly acute for smaller businesses, which have less cash on hand to meet payments.
Spot Market: This market is usually comprised of motor fuels that have not been pre-allocated to the integrated or branded outlets. Retailers and other fuel distributors purchase fuel at terminals, or “racks,” where costs fluctuate based on current prices.
Summer-Fuel Blends: Several state and local governments have developed fuel regulations to control for the formation of smog during summer months. These generally require that gasoline sold during the summer have a lower Reid vapor pressure (RVP), which measures the gasoline’s potential to emit vapors and can contribute to the formation of smog.
Terminal: A bulk gasoline terminal is a gasoline storage facility that receives gasoline by pipeline, ship or barge, and has a gasoline throughput greater than 20,000 barrels per day. The loading rack at the terminal is the broad term for the loading arms, pumps, meters, shutoff valves, relief valves and other piping and valves that fill delivery tank trucks picking up product at the terminal.
Tight Supplies: Describes a situation in which demand for gasoline or crude oil exceeds the supply available, and prices rise based on this supply/demand imbalance. Also known as “market shorts” or “upsets.”
Ultra Low Sulfur Diesel (ULSD): ULSD is a clean-burning diesel fuel that is defined by the United States Environmental Protection Agency (EPA) to have a maximum sulfur content of 15 parts per million (ppm). It was phased into use between 2006 and 2010.
